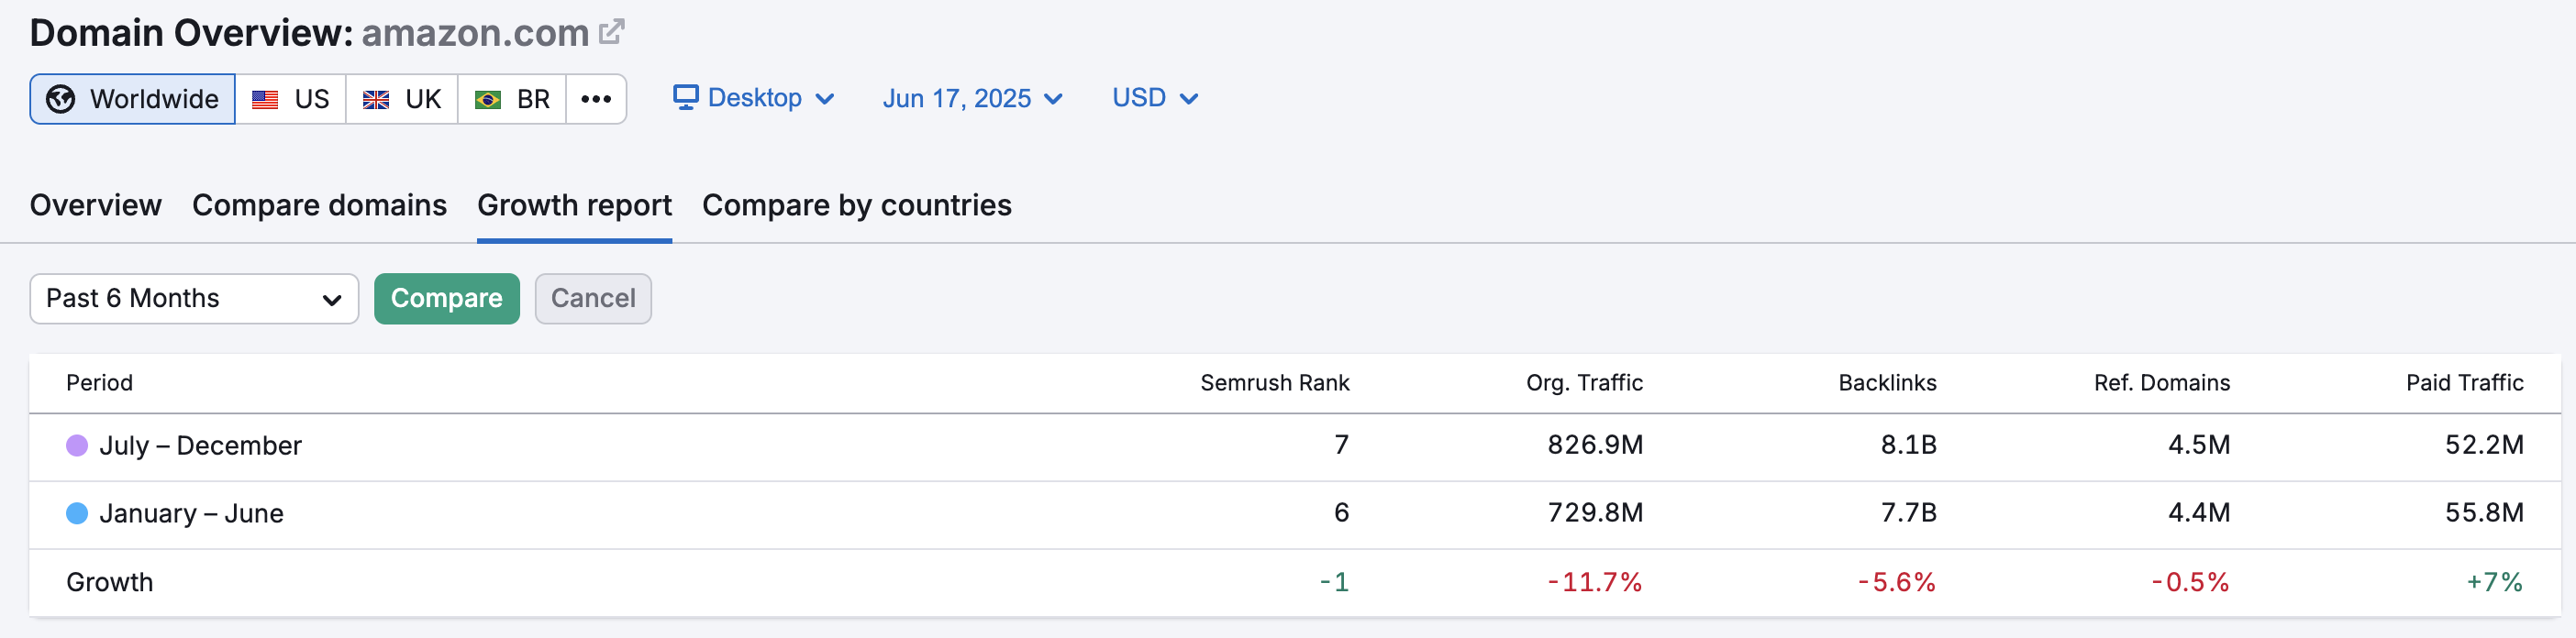
The third tab of the Domain Overview report allows you to set up graphs to compare a domain’s growth by time period (past 6 months, past 3 months, season over season, quarter over quarter, and year over year).
Please note that the Growth Report is available with Guru and Business SEO Toolkit subscriptions.
This allows you to hone in on a competitor’s past strategy and see exactly when they had periods of growth or stagnation.
The metrics measured in this report to look for growth are:
- Organic traffic (estimated)
- Organic keywords
- Organic Traffic Cost
- Backlinks
- Referring domains
- Paid traffic (estimated)
- Paid keywords
Organic Traffic Cost shows how much an advertiser would have to spend on average per month in Google Ads to rank for all of the keywords and positions listed in the report. This number is provided to give you a baseline estimation of how valuable a domain’s keyword portfolio is. This metric is gathered through a proprietary method that takes multiple values into consideration including CPC, volume and more.
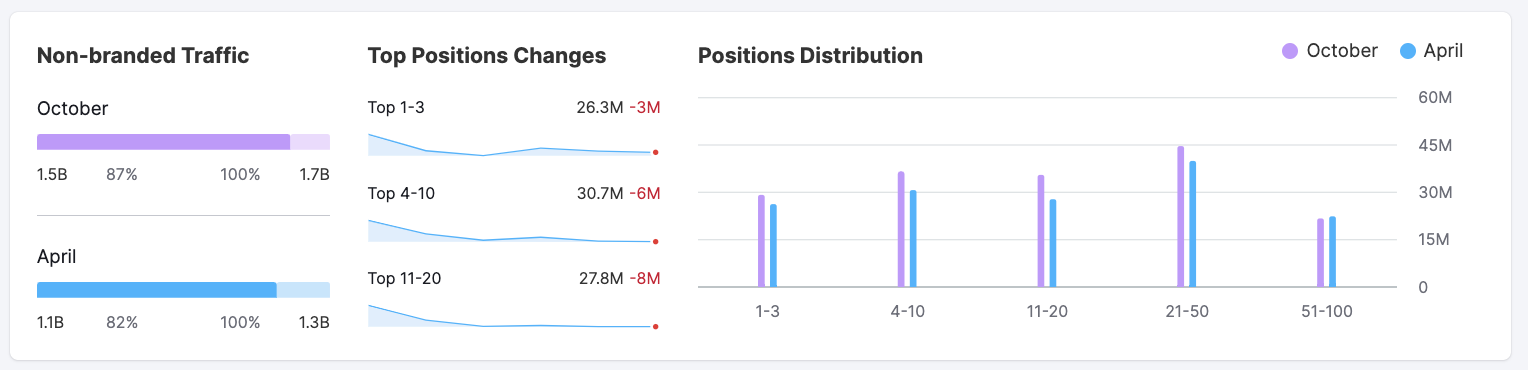
When you compare time periods of organic growth (below), you can also see specifically if there was any growth in non-branded search traffic, top position changes, and any changes in position distribution.
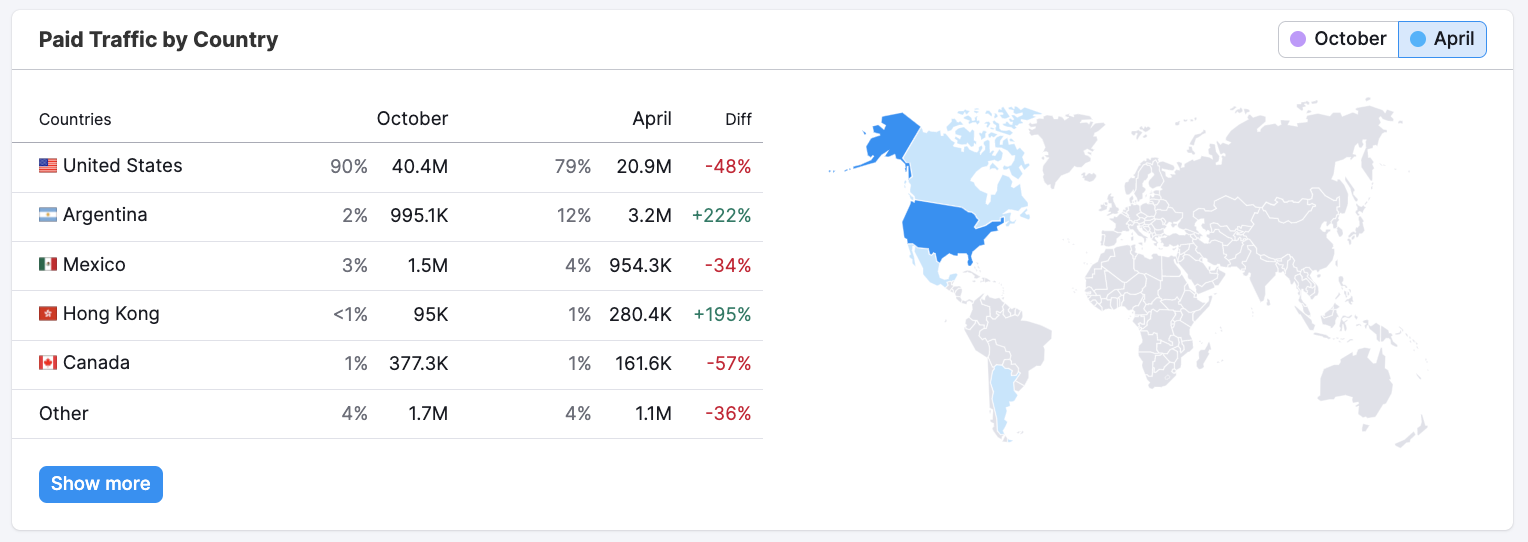
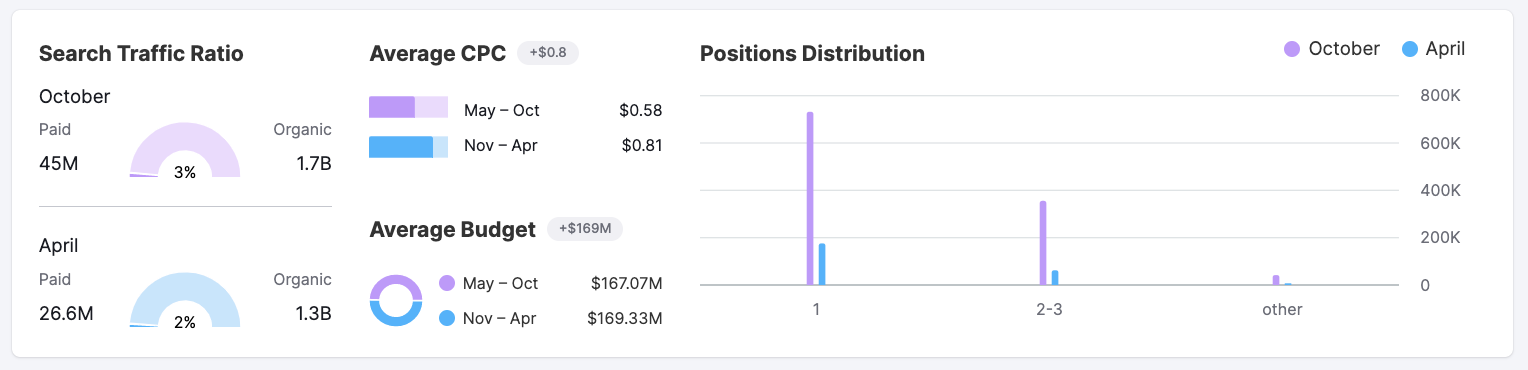
When you look at paid growth (below), you can see if there was any change in the website’s ratio of paid vs. organic search traffic, average CPC and average budget (based on the ads Semrush saw).
In both organic and paid comparisons, you can look into the traffic by country and see where the most growth was over your chosen time periods.